Examples
Overview
This page details all the available examples of MHKiT functions and features. Python examples are available as Jupyter notebooks and MATLAB examples as live scripts. Not all MATLAB examples are available yet but are coming soon.
There are many examples that cover a range of applications and areas of interest. Search for the following tags to identify relevant examples:
Tag |
Description |
|---|---|
wave |
Examples analyzing a WEC, reading WEC model data, assessing wave resource, etc |
current |
Examples analyzing a CEC, reading WEC model data, assessing current resource, etc |
loads |
Examples assessing extreme loading conditions, extreme responses, WDRT, etc |
mooring |
Examples reading MoorDyn data, visualizing mooring lines motion, etc |
power |
Examples analyzing electrical power production, etc |
resource |
Examples involving marine energy resource characterization |
iec |
Examples utilizing IEC marine energy standards |
qc |
Examples preparing data, doing quality control, etc |
Title |
MHKiT-Python |
MHKiT-MATLAB |
Description |
Tags |
|---|---|---|---|---|
Quality Control |
Data quality control workflow example |
qc |
||
River Example |
Visualize river current energy from USGS data |
current, resource, iec |
||
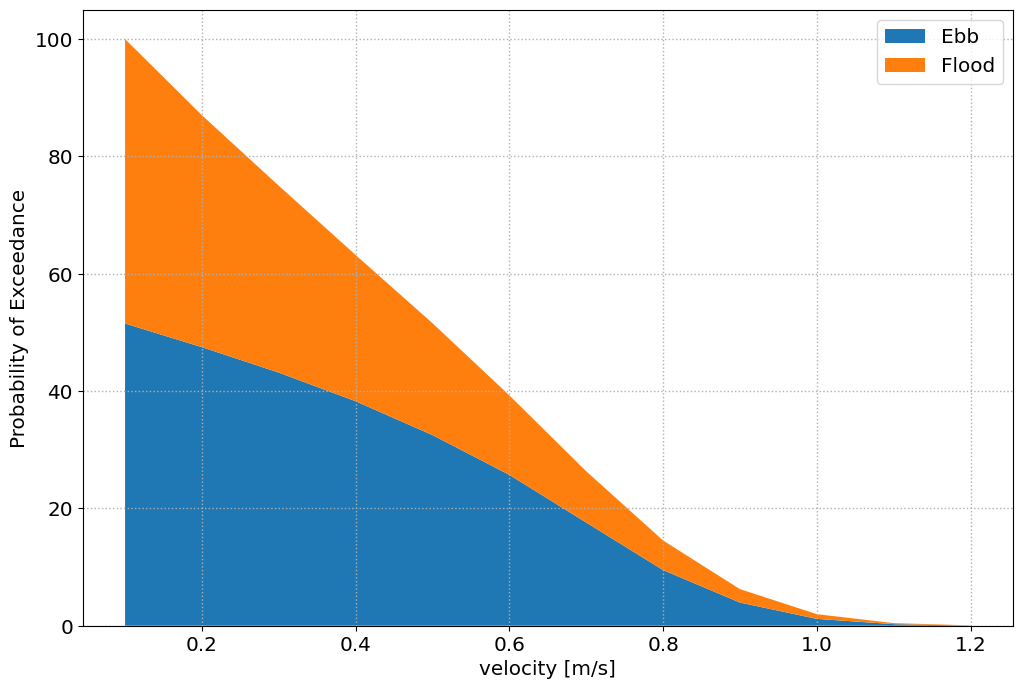
Tidal Example |
Visualize velocity duration curve from NOAA tidal data |
current, resource, iec |
||
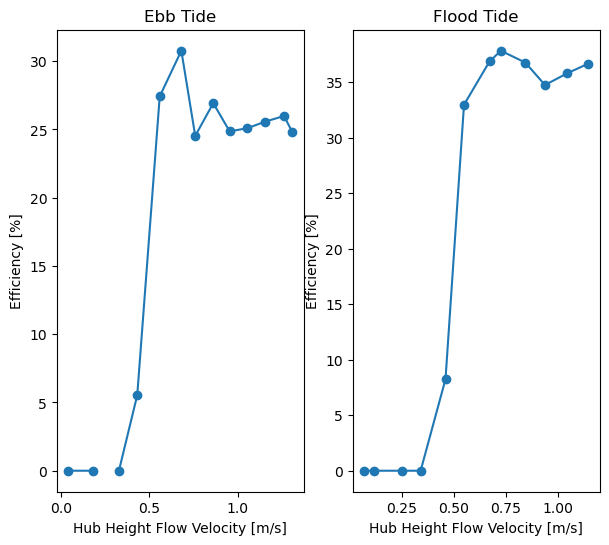
Tidal Power Performance Example |
Tidal power performance testing workflow |
current, iec |
||
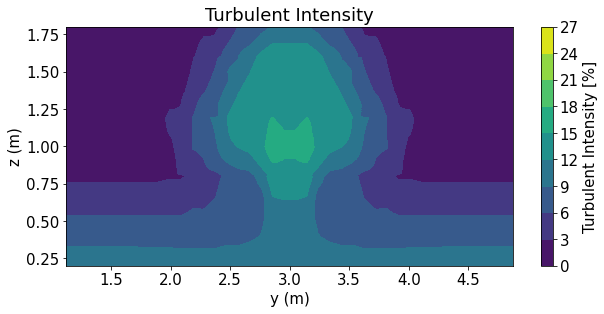
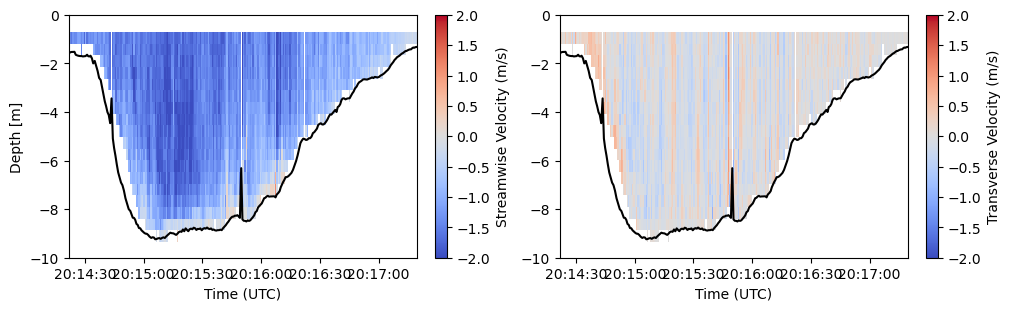
ADCP Example |
Acoustic Doppler Current Profiler (ADCP) analysis workflow |
current, resource |
||
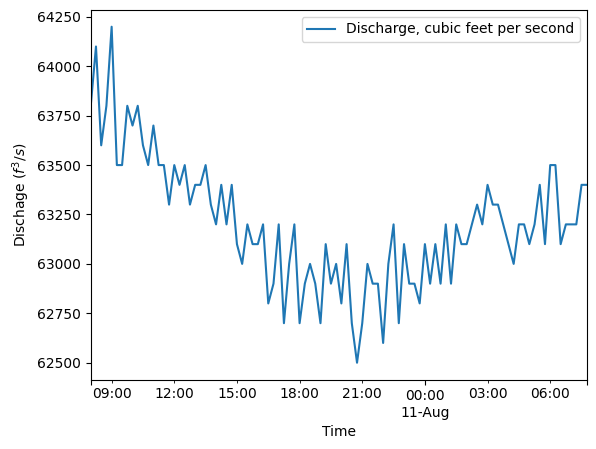
ADCP Discharge Example |
Coming soon |
Acoustic Doppler Current Profiler (ADCP) discharge workflow |
current, resource |
|
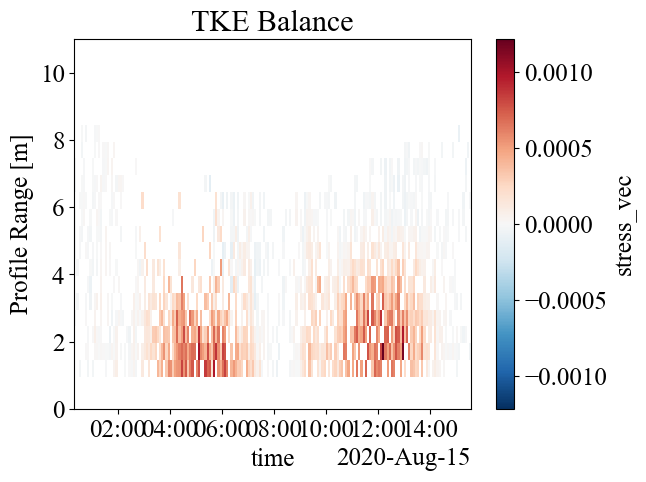
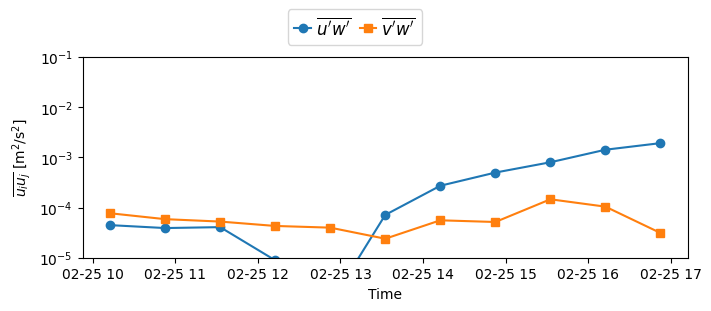
ADV Example |
Acoustic Doppler Velocimetry (ADV) analysis workflow |
current, resource |
||
Tanana River Resource Characterization |
Coming soon |
Site-specific river resource characterization |
current, resource |
|
Delft3D |
Analyze and visualize output from Delft3D |
current, resource |
||
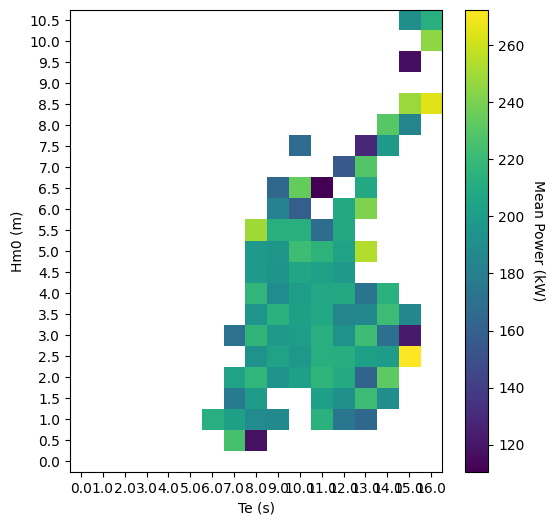
WEC Power Performance |
Visualize WEC Power vs. Wave Resource |
wave, resource, iec |
||
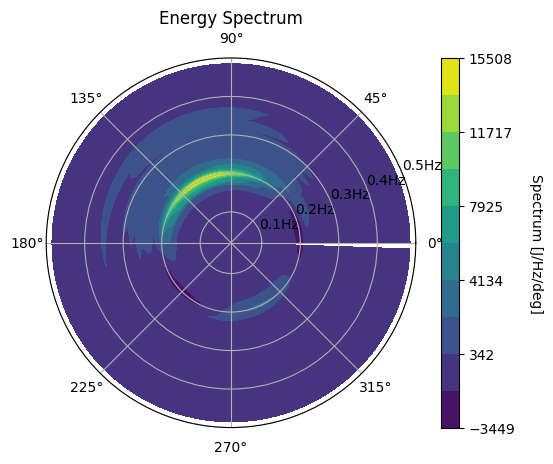
Directional Waves Analysis |
Coming soon |
Visualize directional wave energy spectra from NDBC data |
wave, resource |
|
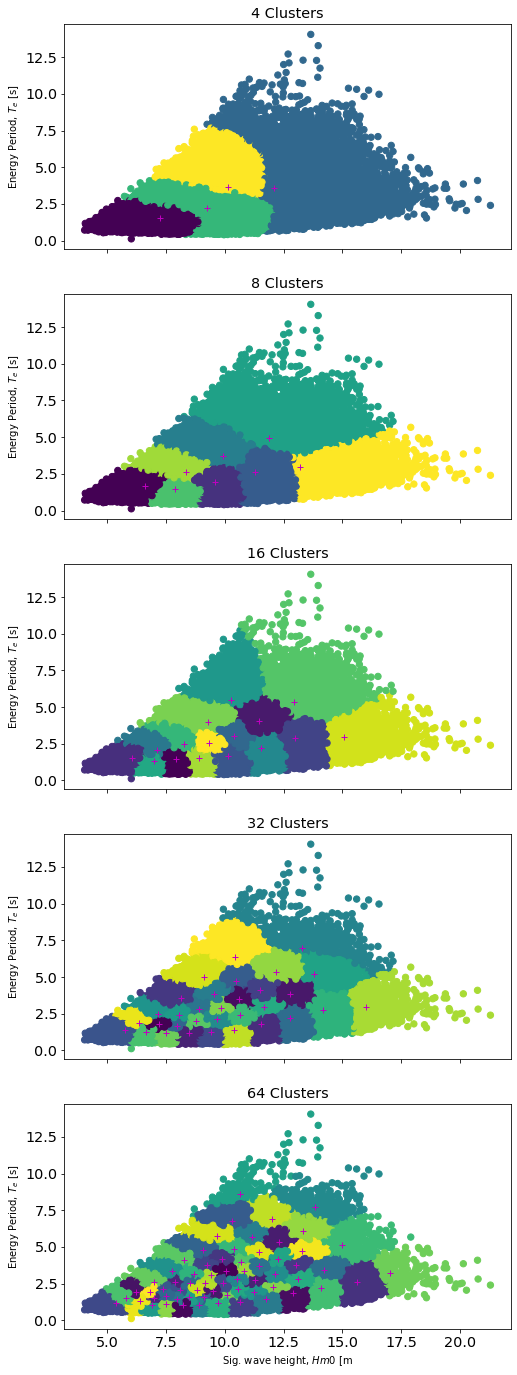
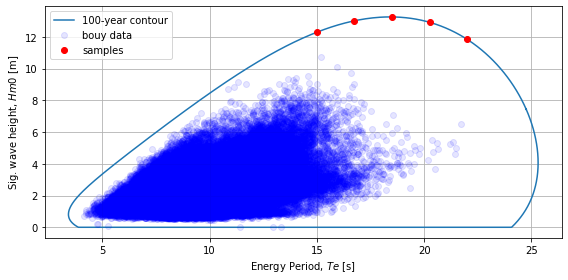
Environmental Contours |
Visualize estimates of extreme sea states |
wave, resource |
||
PacWave Resource Characterization |
Coming soon |
Site-specific resource characterization using NDBC data |
wave, resource, iec |
|
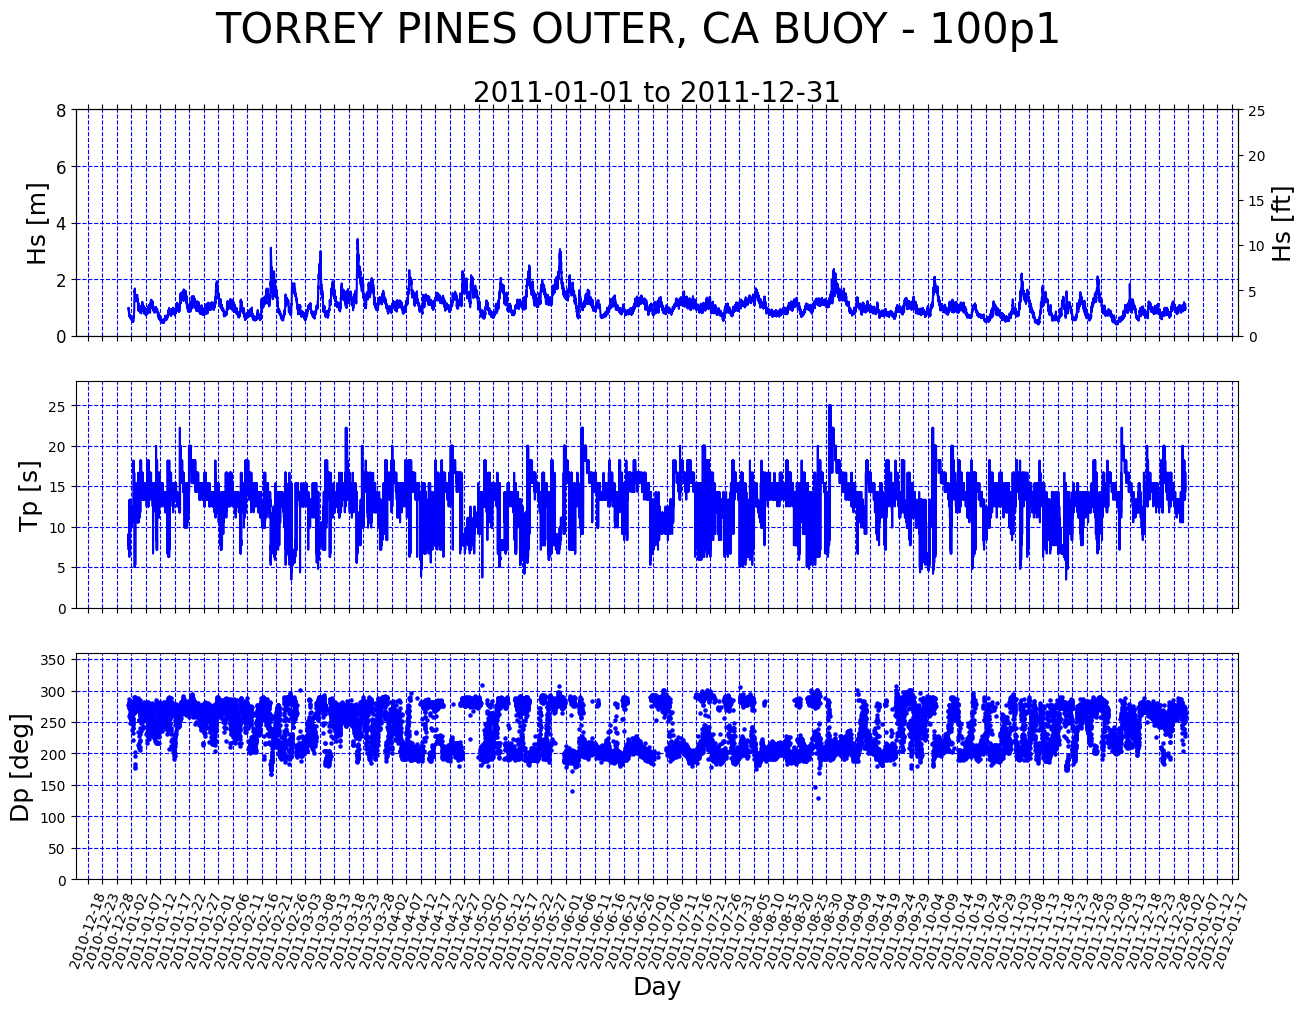
CDIP |
Download and visualize CDIP resource data |
wave, resource |
||
WEC-Sim |
Visualize output from WEC-Sim |
wave |
||
WEC-Sim Power Performance |
Visualize output from WEC-Sim |
wave, resource |
||
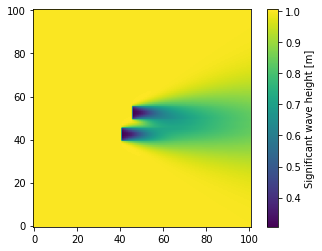
SWAN |
Visualize output from Simulating Waves Nearshore (SWAN) |
wave |
||
WPTO Hindcast |
Download and visualize WPTO Hindcast data |
wave, resource |
||
Metocean Analysis |
Coming soon |
Download and visualize NDBC metocean data |
wave, resource |
|
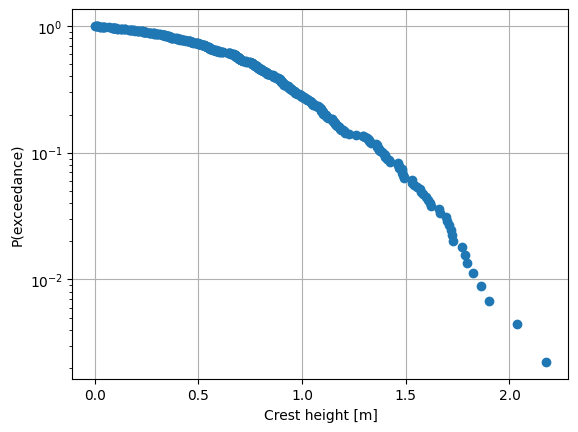
Upcrossing Analysis |
Analyze the surface elevation of a wave |
wave |
||
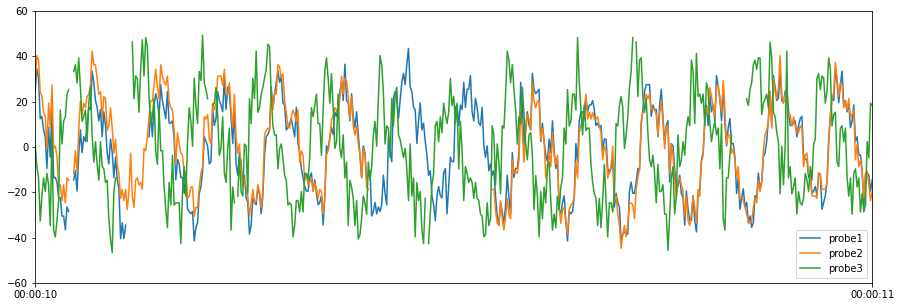
Loads Analysis |
Compute structural loads quantities of interest |
loads |
||
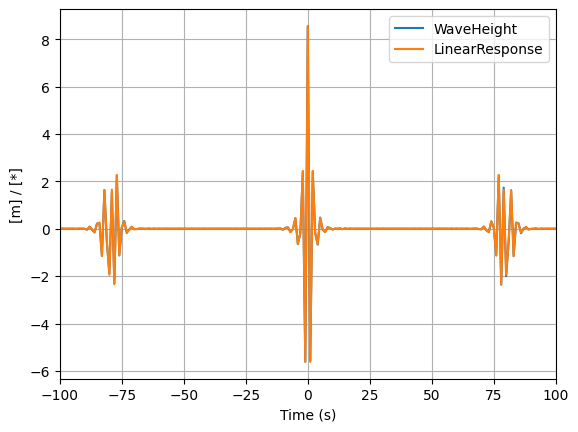
Extreme Response MLER |
Extreme conditions model - Most Likely Extreme Response (MLER) |
loads, wave |
||
Extreme Response Contour |
Extreme conditions model - contour approach |
loads, wave |
||
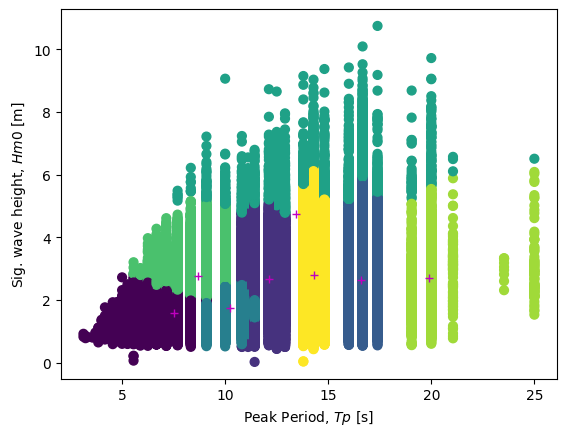
Extreme Response Full Sea State |
Extreme conditions model - full sea state approach |
loads, wave |
||
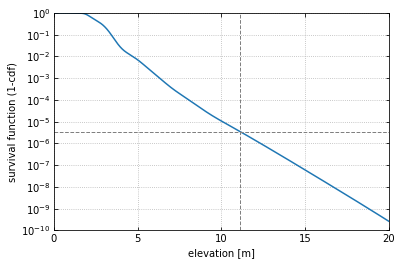
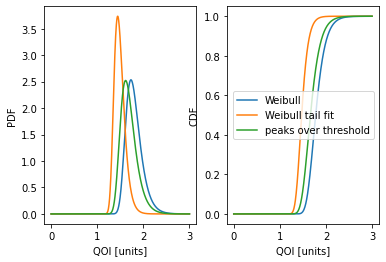
Short-Term Extremes |
Visualize probability distribution of short-term time series data |
loads, wave |
||
Mooring |
Visualize and analyze output from MoorDyn |
mooring, wave |
||
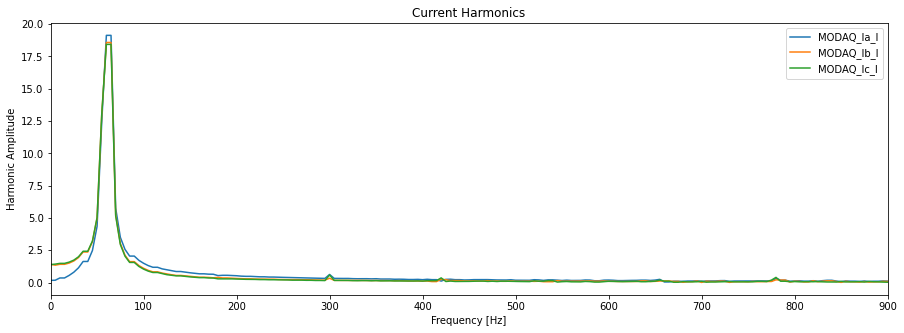
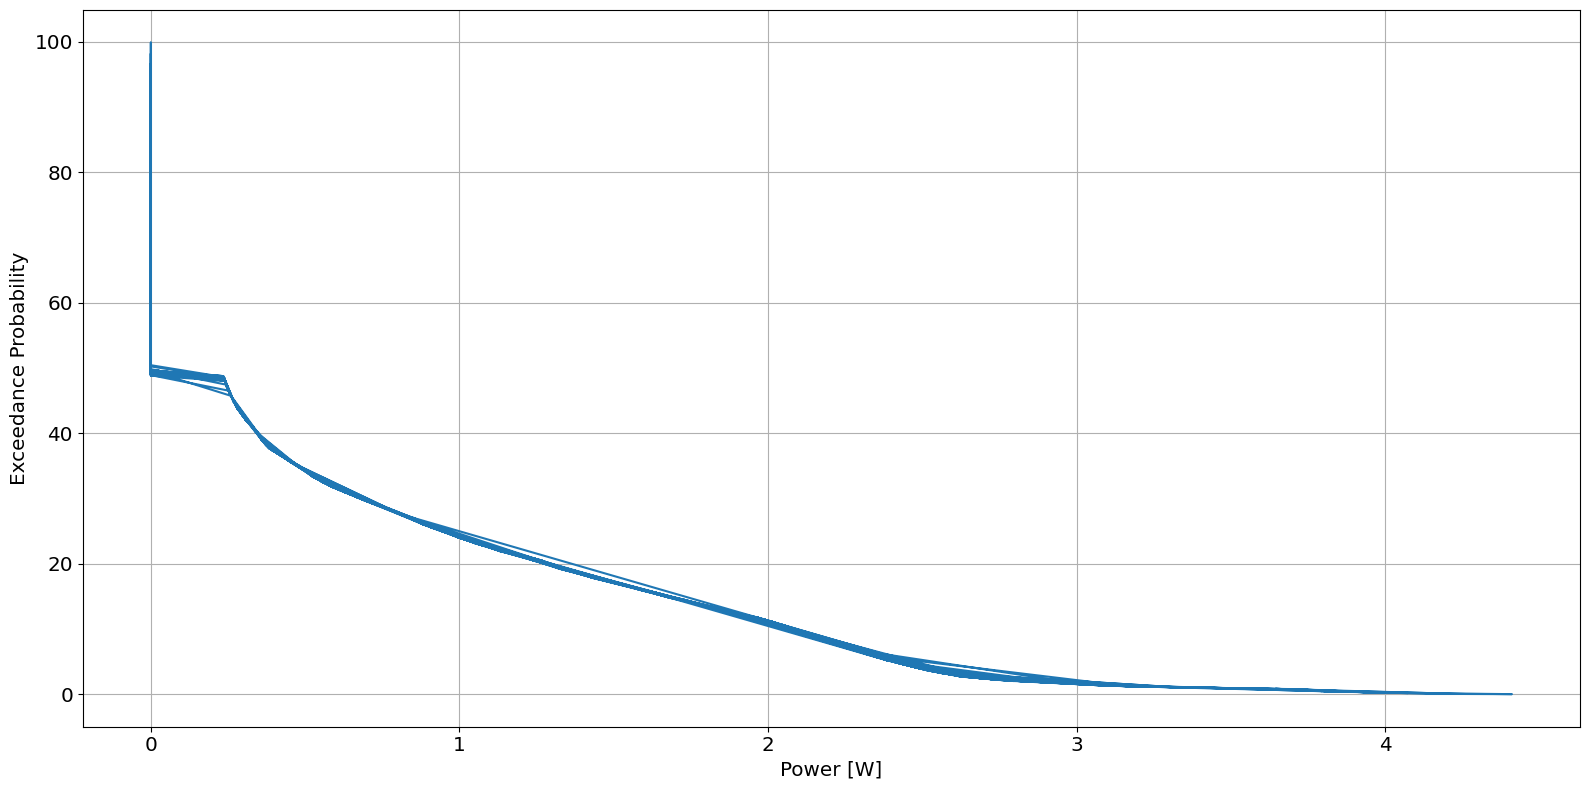
Electrical Power Analysis |
Compute 3-phase power quantities of interest |
power, iec |
||
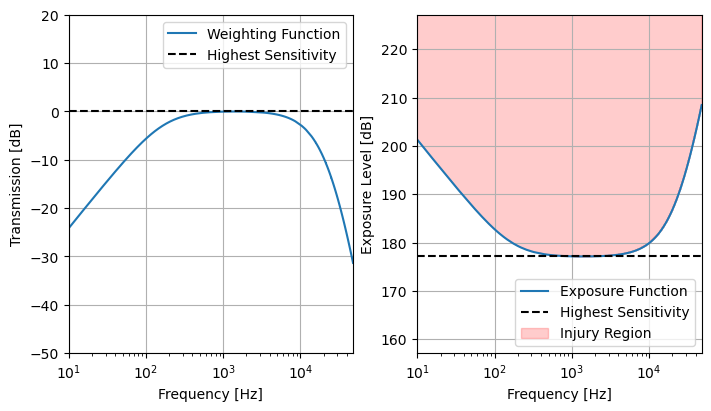
Acoustics |
Ingest, analyze and visualize passive acoustic output |
acoustics, iec |
||
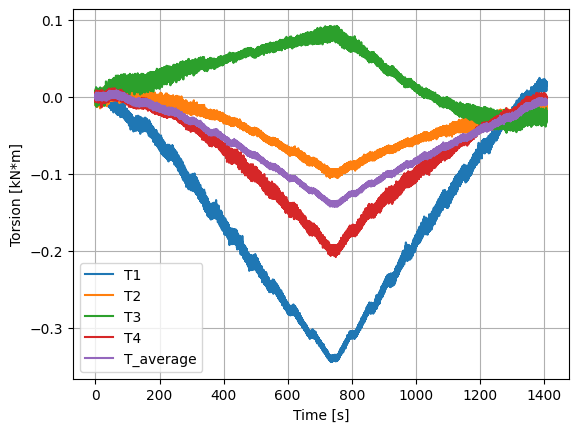
Strain Gauge Processing |
Ingest, analyze and visualize strain gauge measurements |
strain |
All Python Notebooks